Layout Analysis Module Tutorial
I. Overview
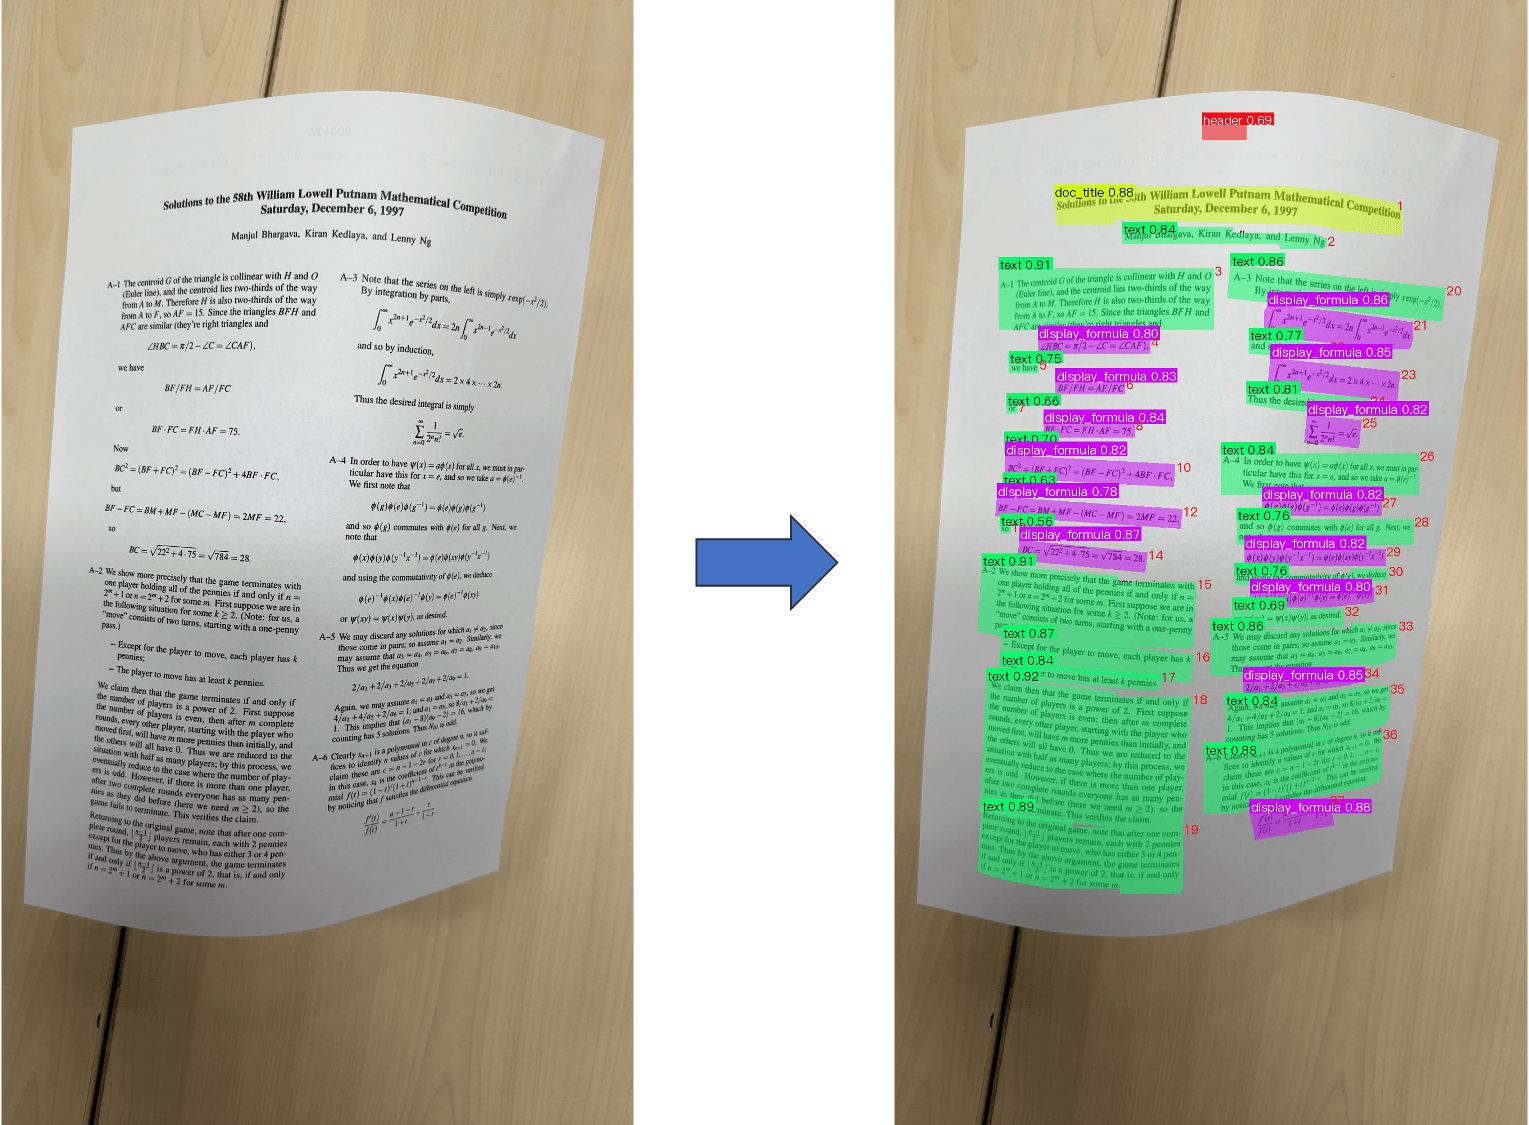
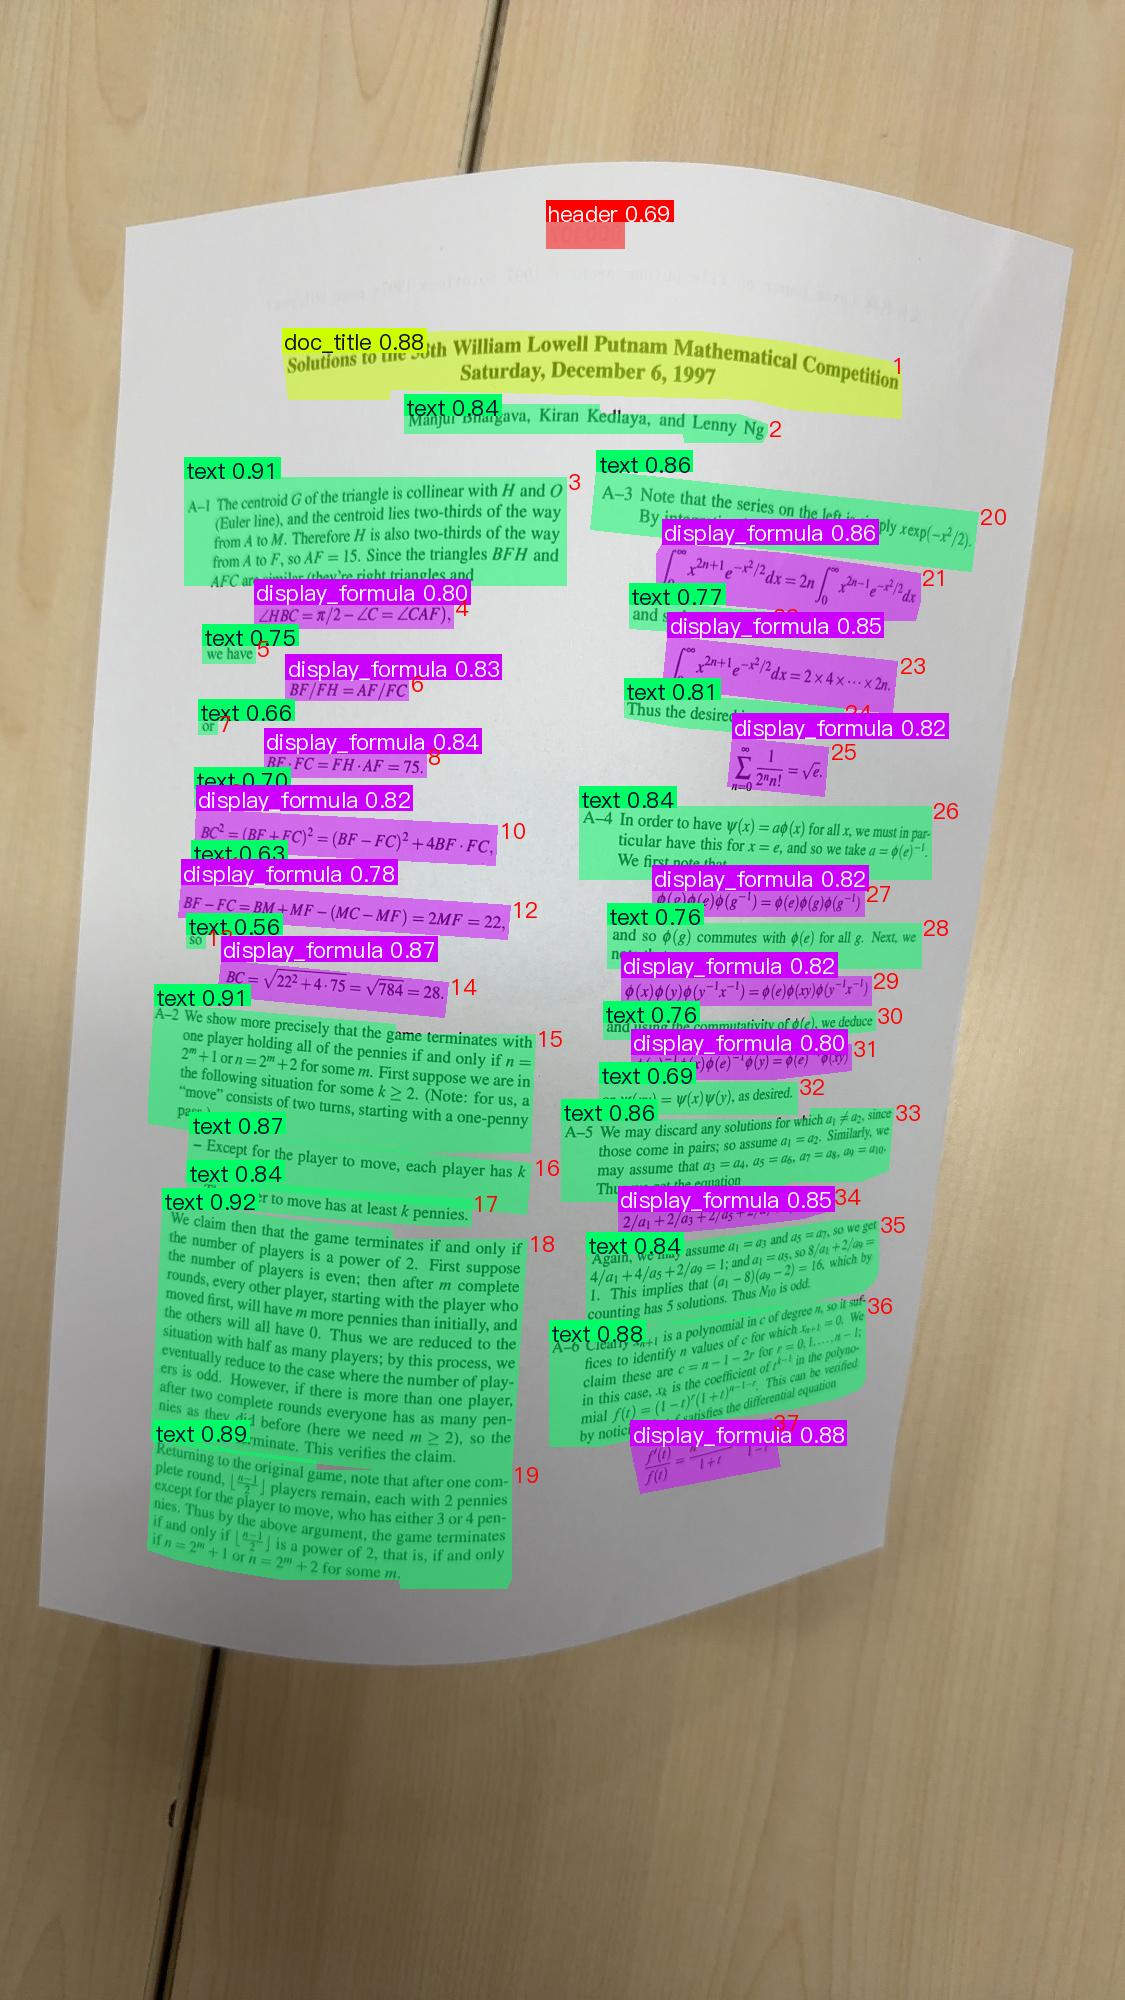
The layout analysis task builds upon layout area detection by further introducing instance segmentation and reading order prediction capabilities. By analyzing input document images, it not only identifies various layout elements (such as text, charts, images, formulas, paragraph titles, abstracts, references, etc.) and outputs their bounding boxes, but also simultaneously outputs the precise contour mask and reading order index for each region, providing more complete structural information for document understanding and information extraction workflows.
The layout analysis module currently supports the PP-DocLayoutV3 model, which is based on the DETR architecture with PPHGNetV2-L as the backbone network. It adds a reading order prediction branch on top of the instance segmentation task, enabling end-to-end learning of reading order relationships among document elements.
II. Supported Model List
The inference time only includes the model inference time and does not include the time for pre- or post-processing.
- The layout analysis model includes 25 common categories: abstract, algorithm, aside text, chart, content, display formula, document title, figure title, footer, footer image, footnote, formula number, header, header image, image, inline formula, number, paragraph title, reference, reference content, seal, table, text, vertical text, and vision footnote
| Model | Model Download Link | GPU Inference Time (ms) A100 GPU |
Model Storage Size (MB) | Introduction |
|---|---|---|---|---|
| PP-DocLayoutV3 | Inference Model/Training Model | 23.77 | 126 | A layout analysis model trained on a self-built dataset containing Chinese and English papers, multi-column magazines, newspapers, PPT, contracts, books, exams, and research reports using DETR. It supports instance segmentation and reading order prediction for 25 layout element categories. |
Note: The evaluation set for the above accuracy metrics is a self-built layout analysis dataset containing images from various Chinese and English document scenarios.
III. Quick Integration 
❗ Before quick integration, please install the PaddleX wheel package. For detailed instructions, refer to PaddleX Local Installation Tutorial
After installing the wheel package, a few lines of code can complete the inference of the layout analysis module. You can switch models under this module freely, and you can also integrate the model inference of the layout analysis module into your project. Before running the following code, please download the demo image to your local machine.
from paddlex import create_model

model_name = "PP-DocLayoutV3"
model = create_model(model_name=model_name)
output = model.predict("layout.jpg", batch_size=1)

for res in output:
    res.print()
    res.save_to_img(save_path="./output/")
    res.save_to_json(save_path="./output/res.json")
Note: The official models would be downloaded from HuggingFace by default. PaddleX also supports specifying the preferred source by setting the environment variable PADDLE_PDX_MODEL_SOURCE. The supported values are huggingface, aistudio, bos, and modelscope. For example, to prioritize using bos, set: PADDLE_PDX_MODEL_SOURCE="bos".
👉 After running, the result is: (Click to expand)
{'res': {'input_path': 'layout.jpg', 'page_index': None, 'boxes': [{'cls_id': 22, 'label': 'text', 'score': 0.98, 'coordinate': [34.1, 349.8, 358.5, 611.0], 'polygon_points': [[34.1, 349.8], [358.5, 349.8], [358.5, 611.0], [34.1, 611.0]], 'order': 3}, ...]}}
[xmin, ymin, xmax, ymax].
- `polygon_points`: List of instance segmentation contour points, in the format [[x1, y1], [x2, y2], ...].
- `order`: Reading order index, an integer indicating the reading order of the region in the document (starting from 0).
After running, the visualization result saved by save_to_img() is shown below, with each region annotated with its category, confidence score, instance segmentation mask, and reading order index:
Relevant methods, parameters, and explanations are as follows:
create_modelinstantiates a layout analysis model (here,PP-DocLayoutV3is used as an example). The detailed explanation is as follows:
| Parameter | Description | Type | Options | Default Value |
|---|---|---|---|---|
model_name |
Name of the model | str |
None | None |
model_dir |
Path to store the model | str |
None | None |
device |
The device used for model inference | str |
It supports specifying specific GPU card numbers, such as "gpu:0", other hardware card numbers, such as "npu:0", or CPU, such as "cpu". | gpu:0 |
engine |
Inference engine | str | None |
Optional paddle, paddle_static, paddle_dynamic, flexible, transformers. |
None |
engine_config |
Inference engine configuration | dict | None |
Different engines support different fields, please refer to Inference Engine and Configuration. | None |
pp_option |
Used for changing runtime mode and other configuration items | PaddlePredictorOption |
For detailed inference configuration, please refer to Compatible Configuration (PaddlePredictorOption). | None |
img_size |
Size of the input image; if not specified, the default PaddleX official model configuration will be used | int/list/None |
|
None |
threshold |
Threshold for filtering low-confidence prediction results; if not specified, the default PaddleX official model configuration will be used | float/dict/None |
|
None |
layout_nms |
Whether to use NMS post-processing to filter overlapping boxes; if not specified, the default PaddleX official model configuration will be used | bool/None |
|
None |
layout_unclip_ratio |
Scaling factor for the side length of the detection box; if not specified, the default PaddleX official model configuration will be used | float/list/dict/None |
|
None |
layout_merge_bboxes_mode |
Merging mode for the detection boxes output by the model; if not specified, the default PaddleX official model configuration will be used | string/dict/None |
|
None |
-
Note that
model_namemust be specified. After specifyingmodel_name, the default PaddleX built-in model parameters will be used. Ifmodel_diris specified, the user-defined model will be used. -
The
predict()method of the layout analysis model is called for inference prediction. The parameters of thepredict()method are explained as follows:
| Parameter | Description | Type | Options | Default Value |
|---|---|---|---|---|
input |
Data for prediction, supporting multiple input types | Python Var/str/list |
|
None |
batch_size |
Batch size | int |
Any integer greater than 0 | 1 |
threshold |
Threshold for filtering low-confidence prediction results | float/dict/None |
|
None |
- The prediction results for each sample can be printed, saved as images, or saved as
jsonfiles:
| Method | Description | Parameter | Parameter Type | Parameter Description | Default Value |
|---|---|---|---|---|---|
print() |
Print results to the terminal | format_json |
bool |
Whether to format the output using JSON indentation |
True |
indent |
int |
Specifies the indentation level for prettifying the output JSON data, only effective when format_json is True |
4 | ||
ensure_ascii |
bool |
Controls whether non-ASCII characters are escaped to Unicode, only effective when format_json is True |
False |
||
save_to_json() |
Save results as a JSON file | save_path |
str |
The file path for saving. When a directory is specified, the saved file is named consistently with the input file type | None |
indent |
int |
Specifies the indentation level for prettifying the output JSON data, only effective when format_json is True |
4 | ||
ensure_ascii |
bool |
Controls whether non-ASCII characters are escaped to Unicode, only effective when format_json is True |
False |
||
save_to_img() |
Save results as an image file (the visualized image includes instance segmentation masks and reading order indices) | save_path |
str |
The file path for saving. When a directory is specified, the saved file is named consistently with the input file type | None |
- Additionally, it also supports obtaining the visualized image with results and the prediction results via attributes, as follows:
| Attribute | Description |
|---|---|
json |
Get the prediction result in json format |
img |
Get the visualized image in dict format, with each region's category, confidence score, instance segmentation mask, and reading order index annotated |
For more information on using PaddleX's single-model inference API, refer to PaddleX Single Model Python Script Usage Instructions.
IV. Custom Development
If you seek higher accuracy from existing models, you can use PaddleX's custom development capabilities to develop better layout analysis models. Before developing a layout analysis model with PaddleX, ensure you have installed PaddleX's Detection-related model training capabilities. The installation process can be found in PaddleX Local Installation Tutorial.
4.1 Data Preparation
Before model training, you need to prepare the corresponding dataset for the task module. PaddleX provides a data validation function for each module, and only data that passes the validation can be used for model training. Additionally, PaddleX provides demo datasets for each module, which you can use to complete subsequent development based on the official demos. If you wish to use private datasets for subsequent model training, refer to the PaddleX Object Detection Task Module Data Annotation Tutorial.
4.1.1 Demo Data Download
You can use the following commands to download the demo dataset to a specified folder:
cd /path/to/paddlex
wget https://paddle-model-ecology.bj.bcebos.com/paddlex/data/doclayoutv3_examples.tar -P ./dataset
tar -xf ./dataset/doclayoutv3_examples.tar -C ./dataset/
4.1.2 Dataset Format Description
The layout analysis module uses the COCOInstSegDataset format, supplemented with reading order annotations. The dataset directory structure is as follows:
doclayoutv3_examples/
├── images/               # Original image directory
│   ├── train_0001.jpg
│   ├── val_0001.jpg
│   └── ...
├── images_mask/          # Image directory for training (same content as images)
│   └── ...
└── annotations/
    ├── instance_train.json   # Training set annotations (COCO instance segmentation format + read_order field)
    └── instance_val.json     # Validation set annotations (COCO instance segmentation format + read_order field)
The annotation files follow the COCO instance segmentation format, with an added read_order field in each annotation to record the reading order of the region in the document (a non-negative integer starting from 0; the read_order values of all annotations within the same image should form a consecutive sequence). An example annotation is as follows:
{
  "annotations": [
    {
      "id": 1,
      "image_id": 1,
      "category_id": 22,
      "bbox": [34.1, 349.8, 324.4, 261.2],
      "segmentation": [[34.1, 349.8, 358.5, 349.8, 358.5, 611.0, 34.1, 611.0]],
      "area": 84740.0,
      "iscrowd": 0,
      "read_order": 0
    }
  ]
}
The 25 categories supported by the model and their descriptions are as follows:
| Category Name (English) | Description |
|---|---|
abstract |
Abstract |
algorithm |
Algorithm |
aside_text |
Sidebar text |
chart |
Chart |
content |
Table of contents |
display_formula |
Display formula |
doc_title |
Document title |
figure_title |
Figure title |
footer |
Footer |
footer_image |
Footer image |
footnote |
Footnote |
formula_number |
Formula number |
header |
Header |
header_image |
Header image |
image |
Image |
inline_formula |
Inline formula |
number |
Page number |
paragraph_title |
Paragraph title |
reference |
Reference |
reference_content |
Reference content |
seal |
Seal |
table |
Table |
text |
Text |
vertical_text |
Vertical text |
vision_footnote |
Figure caption |
4.1.3 Data Validation
A single command can complete data validation:
python main.py -c paddlex/configs/modules/layout_analysis/PP-DocLayoutV3.yaml \
    -o Global.mode=check_dataset \
    -o Global.dataset_dir=./dataset/doclayoutv3_examples
After executing the above command, PaddleX will validate the dataset and collect its basic information. Upon successful execution, the log will print the message Check dataset passed !. The validation result file will be saved in ./output/check_dataset_result.json, and related outputs will be saved in the ./output/check_dataset directory of the current directory. The output directory includes visualized example images (with instance segmentation masks and reading order indices annotated) and histograms of sample distributions.
👉 Validation Result Details (Click to Expand)
The specific content of the validation result file is:
{
  "done_flag": true,
  "check_pass": true,
  "attributes": {
    "num_classes": 11,
    "train_samples": 6351,
    "train_sample_paths": [
      "check_dataset\/demo_img\/train_4141.jpg",
      "check_dataset\/demo_img\/train_3699.jpg",
      "check_dataset\/demo_img\/train_3764.jpg",
      "check_dataset\/demo_img\/train_2279.jpg",
      "check_dataset\/demo_img\/train_4647.jpg",
      "check_dataset\/demo_img\/train_4442.jpg",
      "check_dataset\/demo_img\/train_2006.jpg",
      "check_dataset\/demo_img\/train_1463.jpg",
      "check_dataset\/demo_img\/train_3275.jpg",
      "check_dataset\/demo_img\/train_4509.jpg"
    ],
    "val_samples": 945,
    "val_sample_paths": [
      "check_dataset\/demo_img\/val_0105.jpg",
      "check_dataset\/demo_img\/val_0031.jpg",
      "check_dataset\/demo_img\/val_0755.jpg",
      "check_dataset\/demo_img\/val_0876.jpg",
      "check_dataset\/demo_img\/val_0374.jpg",
      "check_dataset\/demo_img\/val_0566.jpg",
      "check_dataset\/demo_img\/val_0748.jpg",
      "check_dataset\/demo_img\/val_0167.jpg",
      "check_dataset\/demo_img\/val_0345.jpg",
      "check_dataset\/demo_img\/val_0471.jpg"
    ],
    "read_order_validation": {
      "instance_train": {
        "total_images": 500,
        "valid_images": 500,
        "invalid_images": [],
        "pass_rate": 1.0
      },
      "instance_val": {
        "total_images": 100,
        "valid_images": 100,
        "invalid_images": [],
        "pass_rate": 1.0
      }
    }
  },
  "analysis": {
    "histogram": "check_dataset\/histogram.png"
  },
  "dataset_path": "doclayoutv3_examples",
  "show_type": "image",
  "dataset_type": "COCOInstSegDataset"
}
The verification results mentioned above indicate that check_pass being True means the dataset format meets the requirements. Details of other indicators are as follows:
attributes.num_classes: The number of classes in this dataset is 11;attributes.train_samples: The number of training samples in this dataset;attributes.val_samples: The number of validation samples in this dataset;attributes.train_sample_paths: The list of relative paths to the visualization images of training samples in this dataset;attributes.val_sample_paths: The list of relative paths to the visualization images of validation samples in this dataset;attributes.read_order_validation: Validation statistics for theread_orderfield, including the total number of images, number of valid images, and pass rate for both training and validation sets.
The dataset verification also analyzes the distribution of sample numbers across all classes and generates a histogram (histogram.png).
Note: Layout analysis data validation additionally validates theread_order field in each image annotation:
- Completeness: Each annotation must contain a
read_orderfield; - Type validity:
read_ordermust be a non-negative integer; - Consecutiveness: The
read_ordervalues of all annotations within the same image should form a consecutive integer sequence starting from 0 (a warning will be issued if non-consecutive).
4.1.4 Dataset Format Conversion/Dataset Splitting (Optional)
After completing dataset verification, you can re-split the training/validation ratio by modifying the configuration file or appending hyperparameters.
👉 Details on Dataset Splitting (Click to Expand)
(1) Dataset Format Conversion
Layout analysis does not support data format conversion. Please use the COCO instance segmentation format directly (with the read_order field).
(2) Dataset Splitting
Parameters for dataset splitting can be set by modifying the CheckDataset section in the configuration file:
CheckDataset:
  split:
    enable: True
    train_percent: 90
    val_percent: 10
Then execute the command:
python main.py -c paddlex/configs/modules/layout_analysis/PP-DocLayoutV3.yaml \
    -o Global.mode=check_dataset \
    -o Global.dataset_dir=./dataset/doclayoutv3_examples
After dataset splitting, the original annotation files will be renamed to xxx.bak in the original path.
The above parameters can also be set by appending command-line arguments:
python main.py -c paddlex/configs/modules/layout_analysis/PP-DocLayoutV3.yaml \
    -o Global.mode=check_dataset \
    -o Global.dataset_dir=./dataset/doclayoutv3_examples \
    -o CheckDataset.split.enable=True \
    -o CheckDataset.split.train_percent=90 \
    -o CheckDataset.split.val_percent=10
4.2 Model Training
A single command is sufficient to complete model training, taking the training of PP-DocLayoutV3 as an example:
python main.py -c paddlex/configs/modules/layout_analysis/PP-DocLayoutV3.yaml \
    -o Global.mode=train \
    -o Global.dataset_dir=./dataset/doclayoutv3_examples
- Specify the path to the
.yamlconfiguration file of the model (here it isPP-DocLayoutV3.yaml) - Specify the mode as model training:
-o Global.mode=train - Specify the path to the training dataset:
-o Global.dataset_dir - Other related parameters can be set by modifying the
GlobalandTrainfields in the.yamlconfiguration file, or adjusted by appending parameters in the command line. For example, to specify training on the first two GPUs:-o Global.device=gpu:0,1; to set the number of training epochs to 10:-o Train.epochs_iters=10. For more modifiable parameters and their detailed explanations, refer to the PaddleX Common Configuration Parameters for Model Tasks.
👉 More Details (Click to Expand)
- During model training, PaddleX automatically saves model weight files, defaulting to
output. To specify a save path, use the-o Global.outputfield in the configuration file. - PaddleX shields you from the concepts of dynamic graph weights and static graph weights. During model training, both dynamic and static graph weights are produced, and static graph weights are selected by default for model inference.
-
After completing the model training, all outputs are saved in the specified output directory (default is
./output/), typically including: -
train_result.json: Training result record file, recording whether the training task was completed normally, as well as the output weight metrics, related file paths, etc.; train.log: Training log file, recording changes in model metrics and loss during training;config.yaml: Training configuration file, recording the hyperparameter configuration for this training session;.pdparams,.pdema,.pdopt.pdstate,.pdiparams,.json: Model weight-related files, including network parameters, optimizer, EMA, static graph network parameters, static graph network structure, etc.;- Note: The layout analysis model uses an
order_lossbranch during training (with a weight coefficient of 50). This loss term supervises the reading order prediction, and changes inorder_losscan be observed in the training log.
4.3 Model Evaluation
After completing model training, you can evaluate the specified model weight file on the validation set to verify the model's accuracy. Using PaddleX for model evaluation, you can complete the evaluation with a single command:
python main.py -c paddlex/configs/modules/layout_analysis/PP-DocLayoutV3.yaml \
    -o Global.mode=evaluate \
    -o Global.dataset_dir=./dataset/doclayoutv3_examples
- Specify the path to the
.yamlconfiguration file for the model (here it'sPP-DocLayoutV3.yaml) - Set the mode to model evaluation:
-o Global.mode=evaluate - Specify the path to the validation dataset:
-o Global.dataset_dirOther related parameters can be configured by modifying the fields underGlobalandEvaluatein the.yamlconfiguration file. For detailed information, please refer to PaddleX Common Configuration Parameters for Models.
👉 More Details (Click to Expand)
When evaluating the model, you need to specify the model weights file path. Each configuration file has a default weight save path built-in. If you need to change it, simply set it by appending a command line parameter, such as -o Evaluate.weight_path=./output/best_model/best_model/model.pdparams.
After completing the model evaluation, an evaluate_result.json file will be generated, which records the evaluation results, specifically whether the evaluation task was completed successfully, and the model's evaluation metrics, including AP.
4.4 Model Inference
After completing model training and evaluation, you can use the trained model weights for inference predictions. In PaddleX, model inference predictions can be achieved through two methods: command line and wheel package.
4.4.1 Model Inference
-
To perform inference predictions through the command line, simply use the following command. Before running the following code, please download the demo image to your local machine.
Similar to model training and evaluation, the following steps are required: -
Specify the
.yamlconfiguration file path of the model (here it isPP-DocLayoutV3.yaml) - Set the mode to model inference prediction:
-o Global.mode=predict - Specify the model weights path:
-o Predict.model_dir="./output/best_model/inference" -
Specify the input data path:
-o Predict.input="..."Other related parameters can be set by modifying the fields underGlobalandPredictin the.yamlconfiguration file. For details, please refer to PaddleX Common Model Configuration File Parameter Description. -
Alternatively, you can use the PaddleX wheel package for inference, easily integrating the model into your own project. To integrate, simply add the
model_dir="/output/best_model/inference"parameter to thecreate_modelfunction in the quick integration method from Step 3.
4.4.2 Weight Conversion
This module supports converting Paddle dynamic graph weights (.pdparams) to safetensors format for direct use with PaddleX's paddle_dynamic and transformers engines. Models supporting weight conversion in this module: PP-DocLayoutV3.
- To perform weight conversion via command line, taking
PP-DocLayoutV3as an example:
python main.py -c paddlex/configs/modules/layout_analysis/PP-DocLayoutV3.yaml \
    -o Global.mode=pdparams2safetensors \
    -o Pdparams2safetensors.input_path=./path/to/model.pdparams \
    -o Pdparams2safetensors.output_dir=./output/safetensors/
- Parameter description:
Global.mode: Set the mode to weight conversion:pdparams2safetensorsPdparams2safetensors.input_path: Path to the input.pdparamsweight file (or a directory containing one)Pdparams2safetensors.output_dir: Output directory for the convertedsafetensorsmodel
After conversion, the output directory will contain model.safetensors, config.json, preprocess_config.json, inference.yml, and other files ready for inference.
For other related parameters, please refer to PaddleX Common Model Configuration Parameters.
4.4.3 Model Integration
The model can be directly integrated into PaddleX pipelines or into your own projects.
- Pipeline Integration
The layout analysis module can be integrated into PaddleX pipelines such as the Document Parsing Pipeline (PaddleOCR-VL series, including PaddleOCR-VL-1.5 and PaddleOCR-VL-1.6). Simply replace the model path to update the layout analysis module.
- Module Integration
The weights you produce can be directly integrated into the layout analysis module. You can refer to the Python example code in the Quick Integration section, simply replacing the model with the path to your trained model.