Chart Parsing Model Module Usage Tutorial
I. Overview
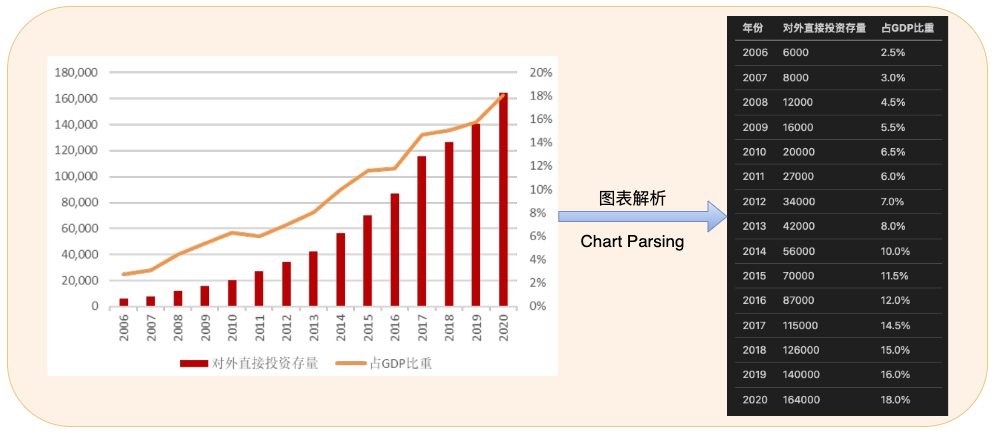
Multimodal chart parsing is a cutting-edge technology in the OCR field, focusing on automatically converting various types of visual charts (such as bar charts, line charts, pie charts, etc.) into underlying data tables and formatting the output. Traditional methods rely on complex orchestration of models like chart key point detection, which involves many prior assumptions and lacks robustness. The models in this module utilize the latest VLM technology, driven by data, learning robust features from massive real-world data. Its application scenarios cover financial analysis, academic research, business reports, etc. — for instance, quickly extracting growth trend data from financial statements, experimental comparison values from scientific papers, or user distribution statistics from market research, assisting users in shifting from "viewing charts" to "using data."
II. Supported Model List
The inference time only includes the model inference time and does not include the time for pre- or post-processing.
| Model | Model Download Link | Model parameter size(B) | Model Storage Size (GB) | Model Score | Description |
|---|---|---|---|---|---|
| PP-Chart2Table | Inference Model | 0.58 | 1.4 | 80.60 | PP-Chart2Table is a SOTA multimodal model developed by the PaddlePaddle team, specializing in chart parsing for both Chinese and English. Its high performance is driven by a novel "Shuffled Chart Data Retrieval" training task, which, combined with a refined token masking strategy, significantly improves its efficiency in converting charts to data tables. The model is further strengthened by an advanced data synthesis pipeline that uses high-quality seed data, RAG, and LLMs persona design to create a richer, more diverse training set. To address the challenge of large-scale unlabeled, out-of-distribution (OOD) data, the team implemented a two-stage distillation process, ensuring robust adaptability and generalization on real-world data. In-house benchmarks demonstrate that PP-Chart2Table not only outperforms models of a similar scale but also achieves accuracy on par with 7-billion parameter Vision Language Models (VLMs) in critical applications. |
Note: The above model scores are the results of internal evaluation set model testing, with a total of 1801 data points, including various chart types such as bar charts, line charts, and pie charts for testing samples under various scenarios such as financial reports, laws and regulations, contracts, etc. There are currently no plans to make them public.
❗ Note:The PP-Chart2Table model was upgraded on June 27, 2025. If you need to use the weights from the previous version of the model, please click the download link
III. Quick Integration
❗ Before quick integration, please install the PaddleX wheel package. For details, please refer to PaddleX Local Installation Tutorial
After completing the installation of the whl package, inference of the document-like visual language model module can be completed with just a few lines of code. You can freely switch models under this module, and you can also integrate model inference from the open document-like visual language model module into your project. Before running the following code, please download the sample image locally.
from paddlex import create_model
model = create_model('PP-Chart2Table')
results = model.predict(
    input={"image": "chart_parsing_02.png"},
    batch_size=1
)
for res in results:
    res.print()
    res.save_to_json(f"./output/res.json")
After running, the result is:
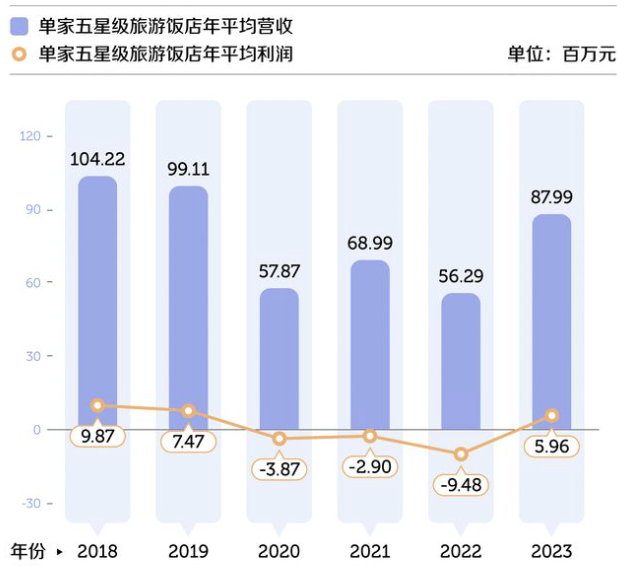
{'res': {'image': 'chart_parsing_02.png', 'result': '年份 | 单家五星级旅游饭店年平均营收 (百万元) | 单家五星级旅游饭店年平均利润 (百万元)\n2018 | 104.22 | 9.87\n2019 | 99.11 | 7.47\n2020 | 57.87 | -3.87\n2021 | 68.99 | -2.9\n2022 | 56.29 | -9.48\n2023 | 87.99 | 5.96'}}
image: Indicates the path of the input image to be predicted
- result: The result information predicted by the model
The visualized printed prediction result is as follows:
年份 | 单家五星级旅游饭店年平均营收 (百万元) | 单家五星级旅游饭店年平均利润 (百万元)
2018 | 104.22 | 9.87
2019 | 99.11 | 7.47
2020 | 57.87 | -3.87
2021 | 68.99 | -2.9
2022 | 56.29 | -9.48
2023 | 87.99 | 5.96
Related methods, parameters, and descriptions are as follows:
create_modelinstantiates the document-like visual language model (takingPP-Chart2Tableas an example here), with specific explanations as follows:
| Parameter | Description | Type | Options | Default |
|---|---|---|---|---|
model_name |
Model name | str |
None | None |
model_dir |
Model storage path | str |
None | None |
device |
Model inference device | str |
Support specifying specific GPU card number, such as "gpu:0", other hardware specific card numbers, such as "npu:0", CPU as "cpu". | gpu:0 |
use_hpip |
Whether to enable high-performance inference plugins. Currently not supported. | bool |
None | False |
hpi_config |
High-performance inference configuration. Currently not supported. | dict | None |
None | None |
-
Among them,
model_namemust be specified. After specifyingmodel_name, the default PaddleX built-in model parameters are used. On this basis, ifmodel_diris specified, the user-defined model is used. -
Call the
predict()method of the document-like visual language model for inference prediction. Thepredict()method parameters includeinput,batch_size, with specific explanations as follows:
| Parameter | Description | Type | Options | Default |
|---|---|---|---|---|
input |
Data to be predicted | dict |
Dict, as multimodal models have different input requirements, it needs to be determined based on the specific model. Specifically:
{'image': image_path} |
None |
batch_size |
Batch size | int |
Integer | 1 |
- Process the prediction results. The prediction result for each sample is the corresponding Result object, which supports operations like printing and saving as a
jsonfile:
| Method | Description | Parameter | Type | Description | Default |
|---|---|---|---|---|---|
print() |
Print results to terminal | format_json |
bool |
Whether to format the output content using JSON indentation |
True |
indent |
int |
Specify the indentation level to beautify the output JSON data for better readability, only effective when format_json is True |
4 | ||
ensure_ascii |
bool |
Control whether to escape non-ASCII characters to Unicode. When set to True, all non-ASCII characters will be escaped; False will keep the original characters, only effective when format_json is True |
False |
||
save_to_json() |
Save the result as a json formatted file | save_path |
str |
Path to save the file. When it's a directory, the saved file name matches the input file type name | None |
indent |
int |
Specify the indentation level to beautify the output JSON data for better readability, only effective when format_json is True |
4 | ||
ensure_ascii |
bool |
Control whether to escape non-ASCII characters to Unicode. When set to True, all non-ASCII characters will be escaped; False will keep the original characters, only effective when format_json is True |
False |
- Additionally, it is also possible to obtain prediction results through attributes, as follows:
| Attribute | Description |
|---|---|
json |
Get the prediction result in json format |
For more information on using the API for single model inference in PaddleX, you can refer to PaddleX Single Model Python Script Usage Instructions.
IV. Secondary Development
The current module temporarily does not support fine-tuning training, only inference integration. Support for fine-tuning training in this module is planned for the future.
V. Weight Conversion
This module supports converting Paddle dynamic graph weights (.pdparams) to safetensors format for direct use with PaddleX's paddle_dynamic and transformers engines. Models supporting weight conversion in this module: PP-Chart2Table.
- To perform weight conversion via command line, taking
PP-Chart2Tableas an example:
python main.py -c paddlex/configs/modules/chart_parsing/PP-Chart2Table.yaml \
    -o Global.mode=pdparams2safetensors \
    -o Pdparams2safetensors.input_path=./path/to/model.pdparams \
    -o Pdparams2safetensors.output_dir=./output/safetensors/
- Parameter description:
Global.mode: Set the mode to weight conversion:pdparams2safetensorsPdparams2safetensors.input_path: Path to the input.pdparamsweight file (or a directory containing one)Pdparams2safetensors.output_dir: Output directory for the convertedsafetensorsmodel
After conversion, the output directory will contain model.safetensors, config.json, preprocess_config.json, inference.yml, and other files ready for inference.
For other related parameters, please refer to PaddleX Common Model Configuration Parameters.