Table Cell Detection Module Usage Guide
I. Overview
The table cell detection module is a key component of table recognition tasks, responsible for locating and marking each cell area in table images. The performance of this module directly affects the accuracy and efficiency of the entire table recognition process. The table cell detection module typically outputs bounding boxes for each cell area, which will be passed as input to the table recognition pipeline for subsequent processing.
II. List of Supported Models
The inference time only includes the model inference time and does not include the time for pre- or post-processing.
| Model | Model Download Link | mAP(%) | GPU Inference Time (ms) [Normal Mode / High-Performance Mode] |
CPU Inference Time (ms) [Normal Mode / High-Performance Mode] |
Model Storage Size (MB) | Introduction |
|---|---|---|---|---|---|---|
| RT-DETR-L_wired_table_cell_det | Inference Model/Training Model | 82.7 | 33.47 / 27.02 | 402.55 / 256.56 | 124M | RT-DETR is the first real-time end-to-end object detection model. The Baidu PaddlePaddle Vision Team, based on RT-DETR-L as the base model, has completed pretraining on a self-built table cell detection dataset, achieving good performance for both wired and wireless table cell detection. |
| RT-DETR-L_wireless_table_cell_det | Inference Model/Training Model |
Test Environment Description:
- Performance Test Environment
- Test Dataset: PaddleX Internal Self-built Evaluation Dataset.
- Hardware Configuration:
- GPU: NVIDIA Tesla T4
- CPU: Intel Xeon Gold 6271C @ 2.60GHz
- Software Environment:
- Ubuntu 20.04 / CUDA 11.8 / cuDNN 8.9 / TensorRT 8.6.1.6
- paddlepaddle 3.0.0 / paddlex 3.0.3
  </li>
  <li><b>Inference Mode Description</b></li>
| Mode | GPU Configuration | CPU Configuration | Acceleration Technology Combination |
|---|---|---|---|
| Normal Mode | FP32 Precision / No TRT Acceleration | FP32 Precision / 8 Threads | PaddleInference |
| High-Performance Mode | Optimal combination of pre-selected precision types and acceleration strategies | FP32 Precision / 8 Threads | Pre-selected optimal backend (Paddle/OpenVINO/TRT, etc.) |
III. Quick Integration
❗ Before quick integration, please install the PaddleX wheel package first. For details, refer to the PaddleX Local Installation Guide.
After installing the wheel package, you can complete the inference of the table cell detection module with just a few lines of code. You can switch between the models under this module at will, and you can also integrate the model inference of the table cell detection module into your project. Before running the following code, please download the example image to your local machine.
from paddlex import create_model
model = create_model(model_name="RT-DETR-L_wired_table_cell_det")
output = model.predict("table_recognition.jpg",  threshold=0.3, batch_size=1)
for res in output:
    res.print(json_format=False)
    res.save_to_img("./output/")
    res.save_to_json("./output/res.json")
Note: The official models would be download from HuggingFace by first. PaddleX also support to specify the preferred source by setting the environment variable PADDLE_PDX_MODEL_SOURCE. The supported values are huggingface, aistudio, bos, and modelscope. For example, to prioritize using bos, set: PADDLE_PDX_MODEL_SOURCE="bos".
👉 After running, the result is: (Click to expand)
{"input_path": "table_recognition.jpg", "page_index": None, "boxes": [{"cls_id": 0, "label": "cell", "score": 0.9319108128547668, "coordinate": [109.83584594726562, 95.89978790283203, 212.70770263671875, 127.05546569824219]}, {"cls_id": 0, "label": "cell", "score": 0.9308021664619446, "coordinate": [109.75360870361328, 64.86648559570312, 212.84799194335938, 95.82242584228516]}, {"cls_id": 0, "label": "cell", "score": 0.9255117177963257, "coordinate": [110.005126953125, 30.894376754760742, 212.81178283691406, 64.80416107177734]}, {"cls_id": 0, "label": "cell", "score": 0.918117344379425, "coordinate": [212.87246704101562, 30.97587013244629, 403.8023986816406, 64.86235046386719]}, {"cls_id": 0, "label": "cell", "score": 0.9053983688354492, "coordinate": [212.89151000976562, 95.95629119873047, 403.36572265625, 127.11717224121094]}, {"cls_id": 0, "label": "cell", "score": 0.8567661046981812, "coordinate": [212.77899169921875, 64.98127746582031, 403.94781494140625, 95.87938690185547]}, {"cls_id": 0, "label": "cell", "score": 0.7800847887992859, "coordinate": [404.1282653808594, 64.99693298339844, 547.1578979492188, 95.95233917236328]}, {"cls_id": 0, "label": "cell", "score": 0.7557389736175537, "coordinate": [2.6574931144714355, 30.968334197998047, 109.94781494140625, 64.89448547363281]}, {"cls_id": 0, "label": "cell", "score": 0.6763500571250916, "coordinate": [2.534634590148926, 96.2182846069336, 109.79283905029297, 127.09756469726562]}, {"cls_id": 0, "label": "cell", "score": 0.6708637475967407, "coordinate": [404.02423095703125, 95.9552993774414, 547.2798461914062, 127.1763687133789]}, {"cls_id": 0, "label": "cell", "score": 0.6568276286125183, "coordinate": [2.2822303771972656, 65.10485076904297, 109.9916763305664, 95.96409606933594]}, {"cls_id": 0, "label": "cell", "score": 0.6159431338310242, "coordinate": [109.78962707519531, 95.94172668457031, 213.05418395996094, 127.06707763671875]}, {"cls_id": 0, "label": "cell", "score": 0.6098588109016418, "coordinate": [2.2127363681793213, 65.04467010498047, 110.0749282836914, 95.99105834960938]}, {"cls_id": 0, "label": "cell", "score": 0.6019916534423828, "coordinate": [403.98883056640625, 96.00384521484375, 547.2072143554688, 127.17021942138672]}, {"cls_id": 0, "label": "cell", "score": 0.5713056921958923, "coordinate": [404.4563903808594, 30.951345443725586, 547.1254272460938, 65.0811538696289]}, {"cls_id": 0, "label": "cell", "score": 0.5697788000106812, "coordinate": [212.81021118164062, 96.05030822753906, 403.7318115234375, 127.14639282226562]}, {"cls_id": 0, "label": "cell", "score": 0.4522075355052948, "coordinate": [4.883366584777832, 0.22239652276039124, 543.5488891601562, 31.06178855895996]}, {"cls_id": 0, "label": "cell", "score": 0.4165799021720886, "coordinate": [404.32574462890625, 30.99039649963379, 547.0177001953125, 65.01567840576172]}, {"cls_id": 0, "label": "cell", "score": 0.37421756982803345, "coordinate": [4.255210876464844, 0.18794140219688416, 543.521728515625, 30.862964630126953]}, {"cls_id": 0, "label": "cell", "score": 0.37030676007270813, "coordinate": [5.542935371398926, 0.2003617286682129, 541.3729858398438, 31.145313262939453]}, {"cls_id": 0, "label": "cell", "score": 0.34807300567626953, "coordinate": [2.534700393676758, 96.17605590820312, 109.90091705322266, 127.14675903320312]}, {"cls_id": 0, "label": "cell", "score": 0.3399328589439392, "coordinate": [3.5424537658691406, 0.17436155676841736, 543.90283203125, 31.138904571533203]}]}
[xmin, ymin, xmax, ymax]
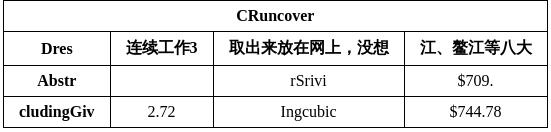
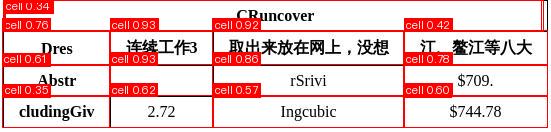
The visualized image is as follows:
Note: Due to network issues, the above URL may not be successfully parsed. If you need the content from this link, please check the validity of the URL and try again. If you do not need the content from this link, please let me know, and I will proceed with answering your question.
The following is the explanation of the methods, parameters, etc.:
- The
create_modelmethod instantiates a table cell detection model (here,RT-DETR-L_wired_table_cell_detis used as an example), with the following details:
| Parameter | Description | Type | Options | Default Value |
|---|---|---|---|---|
model_name |
Name of the model | str |
None | None |
model_dir |
Path to store the model | str |
None | None |
device |
The device used for model inference | str |
It supports specifying specific GPU card numbers, such as "gpu:0", other hardware card numbers, such as "npu:0", or CPU, such as "cpu". | gpu:0 |
use_hpip |
Whether to enable the high-performance inference plugin | bool |
None | False |
hpi_config |
High-performance inference configuration | dict | None |
None | None |
engine |
Inference engine | str | None |
Optional paddle, paddle_static, paddle_dynamic, hpi, flexible, transformers. |
None |
engine_config |
Inference engine configuration | dict | None |
Different engines support different fields, please refer to Inference Engine and Configuration. | None |
pp_option |
Used for changing runtime mode and other configuration items | PaddlePredictorOption |
For detailed inference configuration, please refer to Compatible Configuration (PaddlePredictorOption). | None |
img_size |
Size of the input image; if not specified, the default configuration of the PaddleX official model will be used | int/list |
|
None |
threshold |
Threshold to filter out low-confidence predictions; if not specified, the default configuration of the PaddleX official model will be used. In table cell detection tasks, lowering the threshold appropriately may help to obtain more accurate results. | float/dict |
|
None |
-
The
model_namemust be specified. Oncemodel_nameis specified, the default model parameters from PaddleX will be used. Ifmodel_diris specified, the user-defined model will be used instead. -
The
predict()method of the table cell detection model is called to perform inference and prediction. The parameters of thepredict()method includeinput,batch_size, andthreshold, with the following details:
| Parameter | Parameter Description | Parameter Type | Optional | Default Value |
|---|---|---|---|---|
input |
Data to be predicted, supporting multiple input types | Python Var/str/list |
|
None |
batch_size |
Batch size | int |
Any integer | 1 |
threshold |
Threshold for filtering out low-confidence prediction results; if not specified, the threshold parameter specified in creat_model will be used by default, and if creat_model also does not specify it, the default PaddleX official model configuration will be used |
float/dict |
|
None |
- Process the prediction results, where the prediction result of each sample is a corresponding Result object, and supports operations such as printing, saving as an image, and saving as a
jsonfile:
| Method | Method Description | Parameter | Parameter Type | Parameter Description | Default Value |
|---|---|---|---|---|---|
print() |
Print the result to the terminal | format_json |
bool |
Whether to format the output content using JSON indentation |
True |
indent |
int |
Specify the indentation level to beautify the output JSON data, making it more readable, only effective when format_json is True |
4 | ||
ensure_ascii |
bool |
Control whether to escape non-ASCII characters to Unicode. When set to True, all non-ASCII characters will be escaped; False retains the original characters, only effective when format_json is True |
False |
||
save_to_json() |
Save the result as a JSON file | save_path |
str |
The file path to save to, and when it is a directory, the saved file name is consistent with the input file name | None |
indent |
int |
Specify the indentation level to beautify the output JSON data, making it more readable, only effective when format_json is True |
4 | ||
ensure_ascii |
bool |
Control whether to escape non-ASCII characters to Unicode. When set to True, all non-ASCII characters will be escaped; False retains the original characters, only effective when format_json is True |
False |
||
save_to_img() |
Save the result as an image file | save_path |
str |
The file path to save to, and when it is a directory, the saved file name is consistent with the input file name | None |
- Additionally, it also supports obtaining visualized images with results and prediction results through attributes, as follows:
| Property | Property Description |
|---|---|
json |
Get the prediction result in json format |
img |
Get the visualization image in dict format |
For more information on the usage of PaddleX single-model inference APIs, please refer to PaddleX Single-Model Python Script Usage Instructions.
IV. Secondary Development
If you aim to improve the accuracy of existing models, you can leverage PaddleX's secondary development capabilities to develop a better table cell detection model. Before using PaddleX to develop a table cell detection model, please ensure that the PaddleX table cell detection model training plugin is installed. The installation process can be found in the PaddleX Local Installation Guide.
4.1 Data Preparation
Before training the model, you need to prepare the dataset for the corresponding task module. PaddleX provides a data validation feature for each module, and only data that passes the validation can be used for model training. Additionally, PaddleX offers demo datasets for each module, which you can use to complete subsequent development based on the official demo data. If you wish to use your private dataset for model training, please refer to the PaddleX Object Detection Task Module Data Annotation Guide.
4.1.1 Demo Data Download
You can use the following command to download the demo dataset to the specified folder:
wget https://paddle-model-ecology.bj.bcebos.com/paddlex/data/cells_det_coco_examples.tar -P ./dataset
tar -xf ./dataset/cells_det_coco_examples.tar -C ./dataset/
4.1.2 Data Validation
Data validation can be completed with a single command:
python main.py -c paddlex/configs/modules/table_cells_detection/RT-DETR-L_wired_table_cell_det.yaml \
    -o Global.mode=check_dataset \
    -o Global.dataset_dir=./dataset/cells_det_coco_examples
After executing the above command, PaddleX will verify the dataset and collect basic information about the dataset. If the command runs successfully, it will print Check dataset passed ! in the log. The verification result file is saved in ./output/check_dataset_result.json, and the related outputs will be saved in the ./output/check_dataset directory under the current directory. The output directory includes visualized example sample images and sample distribution histograms.
👉 Verification Result Details (Click to Expand)
The specific content of the verification result file is as follows:
"done_flag": true,
  "check_pass": true,
  "attributes": {
    "num_classes": 1,
    "train_samples": 230,
    "train_sample_paths": [
      "check_dataset\/demo_img\/img_45_2.png",
      "check_dataset\/demo_img\/img_69_1.png",
      "check_dataset\/demo_img\/img_99_1.png",
      "check_dataset\/demo_img\/img_6_1.png",
      "check_dataset\/demo_img\/img_47_3.png",
      "check_dataset\/demo_img\/img_54_2.png",
      "check_dataset\/demo_img\/img_25_1.png",
      "check_dataset\/demo_img\/img_73_1.png",
      "check_dataset\/demo_img\/img_51_2.png",
      "check_dataset\/demo_img\/img_93_3.png"
    ],
    "val_samples": 26,
    "val_sample_paths": [
      "check_dataset\/demo_img\/img_88_2.png",
      "check_dataset\/demo_img\/img_156_0.png",
      "check_dataset\/demo_img\/img_43_4.png",
      "check_dataset\/demo_img\/img_2_4.png",
      "check_dataset\/demo_img\/img_42_4.png",
      "check_dataset\/demo_img\/img_49_0.png",
      "check_dataset\/demo_img\/img_45_1.png",
      "check_dataset\/demo_img\/img_140_0.png",
      "check_dataset\/demo_img\/img_5_1.png",
      "check_dataset\/demo_img\/img_26_3.png"
    ]
  },
  "analysis": {
    "histogram": "check_dataset\/histogram.png"
  },
  "dataset_path": "cells_det_coco_examples",
  "show_type": "image",
  "dataset_type": "COCODetDataset"
In the above verification results, check_pass being true indicates that the dataset format meets the requirements. The explanations for other metrics are as follows:
attributes.num_classes: The number of classes in this dataset is 1;attributes.train_samples: The number of training samples in this dataset is 230;attributes.val_samples: The number of validation samples in this dataset is 26;attributes.train_sample_paths: A list of relative paths to the visualization images of the training samples in this dataset;attributes.val_sample_paths: A list of relative paths to the visualization images of the validation samples in this dataset;
In addition, the dataset verification has analyzed the distribution of sample counts for all classes in the dataset and plotted a histogram (histogram.png):

4.1.3 Dataset Format Conversion/Dataset Splitting (Optional)
After you complete the data verification, you can convert the dataset format by modifying the configuration file or adding hyperparameters. You can also re-split the training/validation ratio of the dataset.
👉 Details of Format Conversion/Dataset Splitting (Click to Expand)
(1) Dataset Format Conversion
Table cell detection supports converting datasets in VOC and LabelMe formats to the COCO format.
Parameters related to dataset verification can be set by modifying the fields under CheckDataset in the configuration file. Some example explanations of parameters in the configuration file are as follows:
CheckDataset:convert:enable: Whether to perform dataset format conversion. Table cell detection supports converting datasets inVOCandLabelMeformats to theCOCOformat. The default isFalse;src_dataset_type: If performing dataset format conversion, the source dataset format must be set. The default isnull, and the available options areVOC,LabelMe,VOCWithUnlabeled, andLabelMeWithUnlabeled. For example, if you want to convert a dataset inLabelMeformat toCOCOformat, using the followingLabelMedataset as an example, you need to modify the configuration as follows:
cd /path/to/paddlex
wget https://paddle-model-ecology.bj.bcebos.com/paddlex/data/det_labelme_examples.tar -P ./dataset
tar -xf ./dataset/det_labelme_examples.tar -C ./dataset/
......
CheckDataset:
  ......
  convert:
    enable: True
    src_dataset_type: LabelMe
  ......
Then execute the command:
python main.py -c paddlex/configs/modules/table_cells_detection/RT-DETR-L_wired_table_cell_det.yaml \
    -o Global.mode=check_dataset \
    -o Global.dataset_dir=./dataset/det_labelme_examples
Of course, the above parameters can also be set by adding command-line arguments. For example, for a dataset in LabelMe format:
python main.py -c paddlex/configs/modules/table_cells_detection/RT-DETR-L_wired_table_cell_det.yaml \
    -o Global.mode=check_dataset \
    -o Global.dataset_dir=./dataset/det_labelme_examples \
    -o CheckDataset.convert.enable=True \
    -o CheckDataset.convert.src_dataset_type=LabelMe
(2) Dataset Splitting
Parameters for dataset splitting can be set by modifying the fields under CheckDataset in the configuration file. Some example explanations of parameters in the configuration file are as follows:
CheckDataset:split:enable: Whether to re-split the dataset. It is set toTruewhen performing dataset format conversion. The default isFalse;train_percent: If re-splitting the dataset, you need to set the percentage of the training set. It is an integer between 0 and 100, and it must sum up to 100 with the value ofval_percent;val_percent: If re-splitting the dataset, you need to set the percentage of the validation set. It is an integer between 0 and 100, and it must sum up to 100 with the value oftrain_percent. For example, if you want to re-split the dataset with 90% for training and 10% for validation, you need to modify the configuration file as follows:
......
CheckDataset:
  ......
  split:
    enable: True
    train_percent: 90
    val_percent: 10
  ......
Then execute the command:
python main.py -c paddlex/configs/modules/table_cells_detection/RT-DETR-L_wired_table_cell_det.yaml \
    -o Global.mode=check_dataset \
    -o Global.dataset_dir=./dataset/cells_det_coco_examples
After the dataset splitting is executed, the original annotation files will be renamed to xxx.bak in the original path.
The above parameters can also be set by adding command-line arguments:
python main.py -c paddlex/configs/modules/table_cells_detection/RT-DETR-L_wired_table_cell_det.yaml \
    -o Global.mode=check_dataset \
    -o Global.dataset_dir=./dataset/cells_det_coco_examples \
    -o CheckDataset.split.enable=True \
    -o CheckDataset.split.train_percent=90 \
    -o CheckDataset.split.val_percent=10
4.2 Model Training
A single command can complete the model training. Taking the table cell detection model RT-DETR-L_wired_table_cell_det as an example:
python main.py -c paddlex/configs/modules/table_cells_detection/RT-DETR-L_wired_table_cell_det.yaml \
    -o Global.mode=train \
    -o Global.dataset_dir=./dataset/cells_det_coco_examples
The following steps are required:
- Specify the path to the model's
.yamlconfiguration file (here it isRT-DETR-L_wired_table_cell_det.yaml). When training other models, the corresponding configuration file must be specified. The correspondence between models and configuration files can be found in the PaddleX Model List (CPU/GPU)). - Specify the mode as model training:
-o Global.mode=train - Specify the path to the training dataset:
-o Global.dataset_dir - Other related parameters can be set by modifying the fields under
GlobalandTrainin the.yamlconfiguration file, or by adding parameters in the command line. For example, to train on the first two GPUs:-o Global.device=gpu:0,1; to set the number of training epochs to 10:-o Train.epochs_iters=10. For more modifiable parameters and their detailed explanations, refer to the configuration file instructions for the corresponding model task module in PaddleX Common Model Configuration Parameters. - New Feature: Paddle 3.0 support CINN (Compiler Infrastructure for Neural Networks) to accelerate training speed when using GPU device. Please specify
-o Train.dy2st=Trueto enable it.
👉 More Information (Click to Expand)
- During model training, PaddleX automatically saves model weight files, with the default directory being
output. If you need to specify a different save path, you can set it through the-o Global.outputfield in the configuration file. - PaddleX abstracts away the concepts of dynamic graph weights and static graph weights for you. During model training, both dynamic and static graph weights are generated. By default, static graph weights are used for model inference.
-
After model training is completed, all outputs are saved in the specified output directory (default is
./output/), and typically include the following: -
train_result.json: The training result record file, which logs whether the training task was completed normally, as well as the metrics of the generated weights and related file paths; train.log: The training log file, which records changes in model metrics and loss during the training process;config.yaml: The training configuration file, which logs the hyperparameter settings for this training session;.pdparams,.pdema,.pdopt.pdstate,.pdiparams,.json: These are model weight-related files, including network parameters, optimizer, EMA, static graph network parameters, and static graph network structure, etc.- Notice: Since Paddle 3.0.0, the format of storing static graph network structure has changed to json(the current
.jsonfile) from protobuf(the former.pdmodelfile) to be compatible with PIR and more flexible and scalable.
4.3 Model Evaluation
After completing model training, you can evaluate the specified model weight file on the validation set to verify the model's accuracy. Using PaddleX for model evaluation can be done with a single command:
python main.py -c paddlex/configs/modules/table_cells_detection/RT-DETR-L_wired_table_cell_det.yaml \
    -o Global.mode=evaluate \
    -o Global.dataset_dir=./dataset/cells_det_coco_examples
Similar to model training, the following steps are required:
- Specify the path of the model's
.yamlconfiguration file (here it isRT-DETR-L_wired_table_cell_det.yaml). - Set the mode to model evaluation:
-o Global.mode=evaluate. - Specify the validation dataset path:
-o Global.dataset_dir. Other related parameters can be set by modifying the fields underGlobalandEvaluatein the.yamlconfiguration file. For details, please refer to PaddleX General Model Configuration File Parameter Description.
👉 More Information (Click to Expand)
When evaluating the model, the path to the model weights file needs to be specified. Each configuration file has a default weight save path built-in. If you need to change it, you can simply set it by appending a command-line parameter, such as -o Evaluate.weight_path=./output/best_model/best_model.pdparams.
After the model evaluation is completed, an evaluate_result.json file will be generated, which records the evaluation results. Specifically, it records whether the evaluation task was completed normally and the model's evaluation metrics, including AP.
4.4 Model Inference and Model Integration
After completing the training and evaluation of the model, you can use the trained model weights for inference prediction or integrate them into Python.
4.4.1 Model Inference
- To perform inference prediction via the command line, you only need the following command. Before running the code below, please download the example image to your local machine. Note: The link may not work due to network issues. If you encounter problems, please check the validity of the link and try again.
Similar to model training and evaluation, the following steps are required:
- Specify the path of the model's
.yamlconfiguration file (here it isRT-DETR-L_wired_table_cell_det.yaml) - Specify the mode as model inference prediction:
-o Global.mode=predict - Specify the model weight path:
-o Predict.model_dir="./output/best_model/inference" - Specify the input data path:
-o Predict.input="..."
Other related parameters can be set by modifying the fields under Global and Predict in the .yaml configuration file. For details, please refer to PaddleX General Model Configuration File Parameter Description.
4.4.2 Weight Conversion
This module supports converting Paddle dynamic graph weights (.pdparams) to safetensors format for direct use with PaddleX's paddle_dynamic and transformers engines. Models supporting weight conversion in this module: RT-DETR-L_wired_table_cell_det, RT-DETR-L_wireless_table_cell_det.
- To perform weight conversion via command line, taking
RT-DETR-L_wired_table_cell_detas an example:
python main.py -c paddlex/configs/modules/table_cells_detection/RT-DETR-L_wired_table_cell_det.yaml \
    -o Global.mode=pdparams2safetensors \
    -o Pdparams2safetensors.input_path=./path/to/model.pdparams \
    -o Pdparams2safetensors.output_dir=./output/safetensors/
- Parameter description:
Global.mode: Set the mode to weight conversion:pdparams2safetensorsPdparams2safetensors.input_path: Path to the input.pdparamsweight file (or a directory containing one)Pdparams2safetensors.output_dir: Output directory for the convertedsafetensorsmodel
After conversion, the output directory will contain model.safetensors, config.json, preprocess_config.json, inference.yml, and other files ready for inference.
For other related parameters, please refer to PaddleX Common Model Configuration Parameters.
4.4.3 Model Integration
The model can be directly integrated into the PaddleX pipeline or into your own project.
1.pipeline Integration
The table cell detection module can be integrated into the PaddleX pipeline General Table Recognition pipeline v2. Simply replacing the model path will complete the model update for the table cell detection module in the relevant pipeline. In pipeline integration, you can deploy your model using high-performance deployment and serving deployment.
2.Module Integration
The weights you generate can be directly integrated into the table cell detection module. You can refer to the Python example code in Quick Integration. Simply replace the model with the path of the model you have trained.
You can also use the PaddleX high-performance inference plugin to optimize the inference process of your model and further improve efficiency. For detailed procedures, please refer to the PaddleX High-Performance Inference Guide.