Layout Detection Module Tutorial
I. Overview
The core task of structure analysis is to parse and segment the content of input document images. By identifying different elements in the image (such as text, charts, images, etc.), they are classified into predefined categories (e.g., pure text area, title area, table area, image area, list area, etc.), and the position and size of these regions in the document are determined.
II. Supported Model List
- The layout detection model includes 23 common categories: document title, paragraph title, text, page number, abstract, table of contents, references, footnotes, header, footer, algorithm, formula, formula number, image, figure caption, table, table caption, seal, figure title, figure, header image, footer image, and sidebar text
| Model | Model Download Link | mAP(0.5) (%) | GPU Inference Time (ms) [Normal Mode / High-Performance Mode] |
CPU Inference Time (ms) [Normal Mode / High-Performance Mode] |
Model Storage Size (M) | Introduction |
|---|---|---|---|---|---|---|
| PP-DocLayout-L | Inference Model/Training Model | 90.4 | 34.6244 / 10.3945 | 510.57 / - | 123.76 M | A high-precision layout area localization model trained on a self-built dataset containing Chinese and English papers, magazines, contracts, books, exams, and research reports using RT-DETR-L. |
| PP-DocLayout-M | Inference Model/Training Model | 75.2 | 13.3259 / 4.8685 | 44.0680 / 44.0680 | 22.578 | A layout area localization model with balanced precision and efficiency, trained on a self-built dataset containing Chinese and English papers, magazines, contracts, books, exams, and research reports using PicoDet-L. |
| PP-DocLayout-S | Inference Model/Training Model | 70.9 | 8.3008 / 2.3794 | 10.0623 / 9.9296 | 4.834 | A high-efficiency layout area localization model trained on a self-built dataset containing Chinese and English papers, magazines, contracts, books, exams, and research reports using PicoDet-S. |
❗ The above list includes the 3 core models that are key supported by the text recognition module. The module actually supports a total of 11 full models, including several predefined models with different categories. The complete model list is as follows:
👉 Details of Model List
* Table Layout Detection Model| Model | Model Download Link | mAP(0.5) (%) | GPU Inference Time (ms) [Normal Mode / High-Performance Mode] |
CPU Inference Time (ms) [Normal Mode / High-Performance Mode] |
Model Storage Size (M) | Introduction |
|---|---|---|---|---|---|---|
| PicoDet_layout_1x_table | Inference Model/Training Model | 97.5 | 8.02 / 3.09 | 23.70 / 20.41 | 7.4 M | A high-efficiency layout area localization model trained on a self-built dataset using PicoDet-1x, capable of detecting table regions. |
| Model | Model Download Link | mAP(0.5) (%) | GPU Inference Time (ms) [Normal Mode / High-Performance Mode] |
CPU Inference Time (ms) [Normal Mode / High-Performance Mode] |
Model Storage Size (M) | Introduction |
|---|---|---|---|---|---|---|
| PicoDet-S_layout_3cls | Inference Model/Training Model | 88.2 | 8.99 / 2.22 | 16.11 / 8.73 | 4.8 | A high-efficiency layout area localization model trained on a self-built dataset of Chinese and English papers, magazines, and research reports using PicoDet-S. |
| PicoDet-L_layout_3cls | Inference Model/Training Model | 89.0 | 13.05 / 4.50 | 41.30 / 41.30 | 22.6 | A balanced efficiency and precision layout area localization model trained on a self-built dataset of Chinese and English papers, magazines, and research reports using PicoDet-L. |
| RT-DETR-H_layout_3cls | Inference Model/Training Model | 95.8 | 114.93 / 27.71 | 947.56 / 947.56 | 470.1 | A high-precision layout area localization model trained on a self-built dataset of Chinese and English papers, magazines, and research reports using RT-DETR-H. |
| Model | Model Download Link | mAP(0.5) (%) | GPU Inference Time (ms) [Normal Mode / High-Performance Mode] |
CPU Inference Time (ms) [Normal Mode / High-Performance Mode] |
Model Storage Size (M) | Introduction |
|---|---|---|---|---|---|---|
| PicoDet_layout_1x | Inference Model/Training Model | 97.8 | 9.03 / 3.10 | 25.82 / 20.70 | 7.4 | A high-efficiency English document layout area localization model trained on the PubLayNet dataset using PicoDet-1x. |
| Model | Model Download Link | mAP(0.5) (%) | GPU Inference Time (ms) [Normal Mode / High-Performance Mode] |
CPU Inference Time (ms) [Normal Mode / High-Performance Mode] |
Model Storage Size (M) | Introduction |
|---|---|---|---|---|---|---|
| PicoDet-S_layout_17cls | Inference Model/Training Model | 87.4 | 9.11 / 2.12 | 15.42 / 9.12 | 4.8 | A high-efficiency layout area localization model trained on a self-built dataset of Chinese and English papers, magazines, and research reports using PicoDet-S. |
| PicoDet-L_layout_17cls | Inference Model/Training Model | 89.0 | 13.50 / 4.69 | 43.32 / 43.32 | 22.6 | A balanced efficiency and precision layout area localization model trained on a self-built dataset of Chinese and English papers, magazines, and research reports using PicoDet-L. |
| RT-DETR-H_layout_17cls | Inference Model/Training Model | 98.3 | 115.29 / 104.09 | 995.27 / 995.27 | 470.2 | A high-precision layout area localization model trained on a self-built dataset of Chinese and English papers, magazines, and research reports using RT-DETR-H. |
- Performance Test Environment
- Test Dataset:
- Layout Detection Model: A self-built layout area detection dataset by PaddleOCR, containing 500 common document type images such as Chinese and English papers, magazines, contracts, books, exam papers, and research reports.
- Table Layout Detection Model: A self-built table area detection dataset by PaddleOCR, including 7,835 Chinese and English paper document type images with tables.
- 3-Class Layout Detection Model: A self-built layout area detection dataset by PaddleOCR, comprising 1,154 common document type images such as Chinese and English papers, magazines, and research reports.
- 5-Class English Document Area Detection Model: The evaluation dataset of PubLayNet, containing 11,245 images of English documents.
- 17-Class Area Detection Model: A self-built layout area detection dataset by PaddleOCR, including 892 common document type images such as Chinese and English papers, magazines, and research reports.
- Hardware Configuration:
- GPU: NVIDIA Tesla T4
- CPU: Intel Xeon Gold 6271C @ 2.60GHz
- Other Environments: Ubuntu 20.04 / cuDNN 8.6 / TensorRT 8.5.2.2
- Test Dataset:
- Inference Mode Description
| Mode | GPU Configuration | CPU Configuration | Acceleration Technology Combination |
|---|---|---|---|
| Normal Mode | FP32 Precision / No TRT Acceleration | FP32 Precision / 8 Threads | PaddleInference |
| High-Performance Mode | Optimal combination of pre-selected precision types and acceleration strategies | FP32 Precision / 8 Threads | Pre-selected optimal backend (Paddle/OpenVINO/TRT, etc.) |
III. Quick Integration 
❗ Before quick integration, please install the PaddleX wheel package. For detailed instructions, refer to PaddleX Local Installation Tutorial
After installing the wheel package, a few lines of code can complete the inference of the structure analysis module. You can switch models under this module freely, and you can also integrate the model inference of the structure analysis module into your project. Before running the following code, please download the demo image to your local machine.
from paddlex import create_model

model_name = "PP-DocLayout-L"
model = create_model(model_name=model_name)
output = model.predict("layout.jpg", batch_size=1, layout_nms=True)

for res in output:
    res.print()
    res.save_to_img(save_path="./output/")
    res.save_to_json(save_path="./output/res.json")
👉 After running, the result is: (Click to expand)
{'res': {'input_path': 'layout.jpg', 'page_index': None, 'boxes': [{'cls_id': 8, 'label': 'table', 'score': 0.9866330623626709, 'coordinate': [74.30875, 105.7123, 321.98837, 299.10858]}, {'cls_id': 2, 'label': 'text', 'score': 0.9859815835952759, 'coordinate': [34.658115, 349.9102, 358.33835, 611.34314]}, {'cls_id': 2, 'label': 'text', 'score': 0.9850621223449707, 'coordinate': [34.944622, 647.37946, 358.3256, 849.2333]}, {'cls_id': 8, 'label': 'table', 'score': 0.9850116968154907, 'coordinate': [438.0683, 105.377174, 662.8872, 313.88733]}, {'cls_id': 2, 'label': 'text', 'score': 0.9847850799560547, 'coordinate': [385.97052, 497.03925, 710.9549, 697.6805]}, {'cls_id': 2, 'label': 'text', 'score': 0.9805687665939331, 'coordinate': [385.79697, 345.93753, 710.07336, 459.14374]}, {'cls_id': 2, 'label': 'text', 'score': 0.9799897074699402, 'coordinate': [386.07574, 735.3798, 710.60785, 850.2002]}, {'cls_id': 9, 'label': 'table_title', 'score': 0.9375936388969421, 'coordinate': [35.273827, 19.851961, 358.92508, 77.812584]}, {'cls_id': 0, 'label': 'paragraph_title', 'score': 0.8755733966827393, 'coordinate': [386.63184, 476.60715, 699.78345, 490.1164]}, {'cls_id': 0, 'label': 'paragraph_title', 'score': 0.8617452383041382, 'coordinate': [387.27448, 715.95795, 524.38367, 729.20795]}, {'cls_id': 0, 'label': 'paragraph_title', 'score': 0.8607752919197083, 'coordinate': [35.451626, 627.496, 185.63443, 640.4029]}, {'cls_id': 0, 'label': 'paragraph_title', 'score': 0.8575425148010254, 'coordinate': [35.33491, 330.8047, 141.46854, 344.4073]}, {'cls_id': 9, 'label': 'table_title', 'score': 0.7957680225372314, 'coordinate': [385.9386, 19.754547, 711.51184, 75.00631]}]}}
[xmin, ymin, xmax, ymax].
The visualized image is as follows:

Relevant methods, parameters, and explanations are as follows:
create_modelinstantiates a target detection model (here,PP-DocLayout-Lis used as an example). The detailed explanation is as follows:
| Parameter | Description | Type | Options | Default Value |
|---|---|---|---|---|
model_name |
Name of the model | str |
None | None |
model_dir |
Path to store the model | str |
None | None |
device |
The device used for model inference | str |
It supports specifying specific GPU card numbers, such as "gpu:0", other hardware card numbers, such as "npu:0", or CPU, such as "cpu". | gpu:0 |
img_size |
Size of the input image; if not specified, the default PaddleX official model configuration will be used | int/list/None |
|
None |
threshold |
Threshold for filtering low-confidence prediction results; if not specified, the default PaddleX official model configuration will be used | float/dict/None |
|
None |
layout_nms |
Whether to use NMS post-processing to filter overlapping boxes; if not specified, the default PaddleX official model configuration will be used | bool/None |
|
None |
layout_unclip_ratio |
Scaling factor for the side length of the detection box; if not specified, the default PaddleX official model configuration will be used | float/list/dict/None |
|
|
layout_merge_bboxes_mode |
Merging mode for the detection boxes output by the model; if not specified, the default PaddleX official model configuration will be used | string/dict/None |
|
None |
use_hpip |
Whether to enable high-performance inference. | bool |
None | False |
-
Note that
model_namemust be specified. After specifyingmodel_name, the default PaddleX built-in model parameters will be used. Ifmodel_diris specified, the user-defined model will be used. -
The
predict()method of the target detection model is called for inference prediction. The parameters of thepredict()method areinput,batch_size, andthreshold, which are explained as follows:
| Parameter | Description | Type | Options | Default Value |
|---|---|---|---|---|
input |
Data for prediction, supporting multiple input types | Python Var/str/list |
|
None |
batch_size |
Batch size | int |
Any integer greater than 0 | 1 |
threshold |
Threshold for filtering low-confidence prediction results | float/dict/None |
|
|
layout_nms |
Whether to use NMS post-processing to filter overlapping boxes; if not specified, the default PaddleX official model configuration will be used | bool/None |
|
None |
layout_unclip_ratio |
Scaling factor for the side length of the detection box; if not specified, the default PaddleX official model configuration will be used | float/list/dict/None |
|
|
layout_merge_bboxes_mode |
Merging mode for the detection boxes output by the model; if not specified, the default PaddleX official model configuration will be used | string/dict/None |
|
None |
- Additionally, it also supports obtaining the visualized image with results and the prediction results via attributes, as follows:
| Attribute | Description |
|---|---|
json |
Get the prediction result in json format |
img |
Get the visualized image in dict format |
For more information on using PaddleX's single-model inference API, refer to PaddleX Single Model Python Script Usage Instructions.
IV. Custom Development
If you seek higher accuracy from existing models, you can use PaddleX's custom development capabilities to develop better structure analysis models. Before developing a structure analysis model with PaddleX, ensure you have installed PaddleX's Detection-related model training capabilities. The installation process can be found in PaddleX Local Installation Tutorial.
4.1 Data Preparation
Before model training, you need to prepare the corresponding dataset for the task module. PaddleX provides a data validation function for each module, and only data that passes the validation can be used for model training. Additionally, PaddleX provides demo datasets for each module, which you can use to complete subsequent development based on the official demos. If you wish to use private datasets for subsequent model training, refer to the PaddleX Object Detection Task Module Data Annotation Tutorial.
4.1.1 Demo Data Download
You can use the following commands to download the demo dataset to a specified folder:
cd /path/to/paddlex
wget https://paddle-model-ecology.bj.bcebos.com/paddlex/data/det_layout_examples.tar -P ./dataset
tar -xf ./dataset/det_layout_examples.tar -C ./dataset/
4.1.2 Data Validation
A single command can complete data validation:
python main.py -c paddlex/configs/modules/layout_detection/PP-DocLayout-L.yaml \
    -o Global.mode=check_dataset \
    -o Global.dataset_dir=./dataset/det_layout_examples
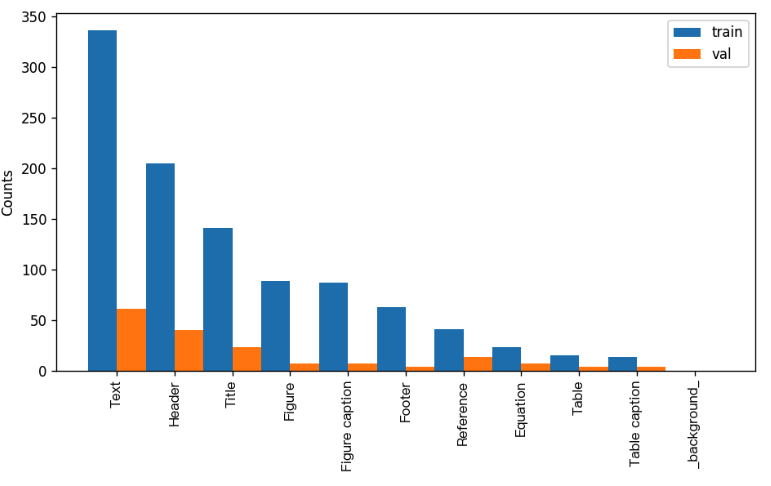
After executing the above command, PaddleX will validate the dataset and collect its basic information. Upon successful execution, the log will print the message Check dataset passed !. The validation result file will be saved in ./output/check_dataset_result.json, and related outputs will be saved in the ./output/check_dataset directory of the current directory. The output directory includes visualized example images and histograms of sample distributions.
👉 Validation Result Details (Click to Expand)
The specific content of the validation result file is:
{
  "done_flag": true,
  "check_pass": true,
  "attributes": {
    "num_classes": 11,
    "train_samples": 90,
    "train_sample_paths": [
      "check_dataset/demo_img/JPEGImages/train_0077.jpg",
      "check_dataset/demo_img/JPEGImages/train_0028.jpg",
      "check_dataset/demo_img/JPEGImages/train_0012.jpg"
    ],
    "val_samples": 20,
    "val_sample_paths": [
      "check_dataset/demo_img/JPEGImages/val_0007.jpg",
      "check_dataset/demo_img/JPEGImages/val_0019.jpg",
      "check_dataset/demo_img/JPEGImages/val_0010.jpg"
    ]
  },
  "analysis": {
    "histogram": "check_dataset/histogram.png"
  },
  "dataset_path": "det_layout_examples",
  "show_type": "image",
  "dataset_type": "COCODetDataset"
}
The verification results mentioned above indicate that check_pass being True means the dataset format meets the requirements. Details of other indicators are as follows:
attributes.num_classes: The number of classes in this dataset is 11;attributes.train_samples: The number of training samples in this dataset is 90;attributes.val_samples: The number of validation samples in this dataset is 20;attributes.train_sample_paths: The list of relative paths to the visualization images of training samples in this dataset;attributes.val_sample_paths: The list of relative paths to the visualization images of validation samples in this dataset;
The dataset verification also analyzes the distribution of sample numbers across all classes and generates a histogram (histogram.png):
4.1.3 Dataset Format Conversion/Dataset Splitting (Optional)
After completing dataset verification, you can convert the dataset format or re-split the training/validation ratio by modifying the configuration file or appending hyperparameters.
👉 Details on Format Conversion/Dataset Splitting (Click to Expand)
(1) Dataset Format Conversion
Layout detection does not support data format conversion.
(2) Dataset Splitting
Parameters for dataset splitting can be set by modifying the CheckDataset section in the configuration file. Examples of some parameters in the configuration file are as follows:
CheckDataset:split:enable: Whether to re-split the dataset. Set toTrueto enable dataset splitting, default isFalse;train_percent: If re-splitting the dataset, set the percentage of the training set. The type is any integer between 0-100, ensuring the sum withval_percentis 100;
For example, if you want to re-split the dataset with a 90% training set and a 10% validation set, modify the configuration file as follows:
......
CheckDataset:
  ......
  split:
    enable: True
    train_percent: 90
    val_percent: 10
  ......
Then execute the command:
python main.py -c paddlex/configs/modules/layout_detection/PP-DocLayout-L.yaml \
    -o Global.mode=check_dataset \
    -o Global.dataset_dir=./dataset/det_layout_examples
After dataset splitting, the original annotation files will be renamed to xxx.bak in the original path.
The above parameters can also be set by appending command-line arguments:
python main.py -c paddlex/configs/modules/layout_detection/PP-DocLayout-L.yaml  \
    -o Global.mode=check_dataset \
    -o Global.dataset_dir=./dataset/det_layout_examples \
    -o CheckDataset.split.enable=True \
    -o CheckDataset.split.train_percent=90 \
    -o CheckDataset.split.val_percent=10
4.2 Model Training
A single command is sufficient to complete model training, taking the training of PP-DocLayout-L as an example:
python main.py -c paddlex/configs/modules/layout_detection/PP-DocLayout-L.yaml \
    -o Global.mode=train \
    -o Global.dataset_dir=./dataset/det_layout_examples
- Specify the path to the
.yamlconfiguration file of the model (here it isPP-DocLayout-L.yaml,When training other models, you need to specify the corresponding configuration files. The relationship between the model and configuration files can be found in the PaddleX Model List (CPU/GPU)) - Specify the mode as model training:
-o Global.mode=train - Specify the path to the training dataset:
-o Global.dataset_dir
Other related parameters can be set by modifying the Global and Train fields in the .yaml configuration file, or adjusted by appending parameters in the command line. For example, to specify training on the first two GPUs: -o Global.device=gpu:0,1; to set the number of training epochs to 10: -o Train.epochs_iters=10. For more modifiable parameters and their detailed explanations, refer to the PaddleX Common Configuration Parameters for Model Tasks.
👉 More Details (Click to Expand)
- During model training, PaddleX automatically saves model weight files, defaulting to
output. To specify a save path, use the-o Global.outputfield in the configuration file. - PaddleX shields you from the concepts of dynamic graph weights and static graph weights. During model training, both dynamic and static graph weights are produced, and static graph weights are selected by default for model inference.
-
After completing the model training, all outputs are saved in the specified output directory (default is
./output/), typically including: -
train_result.json: Training result record file, recording whether the training task was completed normally, as well as the output weight metrics, related file paths, etc.; train.log: Training log file, recording changes in model metrics and loss during training;config.yaml: Training configuration file, recording the hyperparameter configuration for this training session;.pdparams,.pdema,.pdopt.pdstate,.pdiparams,.pdmodel: Model weight-related files, including network parameters, optimizer, EMA, static graph network parameters, static graph network structure, etc.;
4.3 Model Evaluation
After completing model training, you can evaluate the specified model weight file on the validation set to verify the model's accuracy. Using PaddleX for model evaluation, you can complete the evaluation with a single command:
python main.py -c paddlex/configs/modules/layout_detection/PP-DocLayout-L.yaml \
    -o Global.mode=evaluate \
    -o Global.dataset_dir=./dataset/det_layout_examples
- Specify the path to the
.yamlconfiguration file for the model(here it'sPP-DocLayout-L.yaml) - Set the mode to model evaluation:
-o Global.mode=evaluate - Specify the path to the validation dataset:
-o Global.dataset_dirOther related parameters can be configured by modifying the fields underGlobalandEvaluatein the.yamlconfiguration file. For detailed information, please refer to PaddleX Common Configuration Parameters for Models。
👉 More Details (Click to Expand)
When evaluating the model, you need to specify the model weights file path. Each configuration file has a default weight save path built-in. If you need to change it, simply set it by appending a command line parameter, such as -o Evaluate.weight_path=./output/best_model/best_model/model.pdparams.
After completing the model evaluation, an evaluate_result.json file will be generated, which records the evaluation results, specifically whether the evaluation task was completed successfully, and the model's evaluation metrics, including AP.
4.4 Model Inference
After completing model training and evaluation, you can use the trained model weights for inference predictions. In PaddleX, model inference predictions can be achieved through two methods: command line and wheel package.
4.4.1 Model Inference
-
To perform inference predictions through the command line, simply use the following command. Before running the following code, please download the demo image to your local machine.
Similar to model training and evaluation, the following steps are required: -
Specify the
.yamlconfiguration file path of the model (here it isPP-DocLayout-L.yaml) - Set the mode to model inference prediction:
-o Global.mode=predict - Specify the model weights path:
-o Predict.model_dir="./output/best_model/inference" -
Specify the input data path:
-o Predict.input="..."Other related parameters can be set by modifying the fields underGlobalandPredictin the.yamlconfiguration file. For details, please refer to PaddleX Common Model Configuration File Parameter Description. -
Alternatively, you can use the PaddleX wheel package for inference, easily integrating the model into your own project. To integrate, simply add the
model_dir="/output/best_model/inference"parameter to thecreate_model(model_name=model_name, kernel_option=kernel_option)function in the quick integration method from Step 3.
4.4.2 Model Integration
The model can be directly integrated into PaddleX pipelines or into your own projects.
-
Pipeline Integration The structure analysis module can be integrated into PaddleX pipelines such as the General Table Recognition Pipeline and the Document Scene Information Extraction Pipeline v3 (PP-ChatOCRv3-doc). Simply replace the model path to update the layout area localization module. In pipeline integration, you can use high-performance inference and serving deployment to deploy your model.
-
Module Integration The weights you produce can be directly integrated into the layout area localization module. You can refer to the Python example code in the Quick Integration section, simply replacing the model with the path to your trained model.
You can also use the PaddleX high-performance inference plugin to optimize the inference process of your model and further improve efficiency. For detailed procedures, please refer to the PaddleX High-Performance Inference Guide.